Alternative Architecture for Exchange On-Premises (Virtualization)

In my previous article in this series, we discussed Exchange “Alternative Architecture” options for...

There are several areas of sizing & performance that any virtualization admin should become intimately familiar with; CPU, Disk, Memory, HA, DR, etc. Specifically, I’d like to call out CPU sizing & the negative ways it can impact a virtual Exchange deployment when not done correctly.
First off, there are many well-written articles on CPU sizing, most of which are from the VMware perspective. They’re all excellent reading but I’ll summarize for the purposes of this article. In vendor-neutral terminology, on a given host, the total number of assigned processor cores on all of your virtual machines can potentially be greater than the total number of actual cores on the physical host.
Example:On a virtual host with two Intel Xeon E5-2640 2.5GHz CPU’s, each with 6 cores (hyper threading disabled for this example; more on that later), you have a total of 12 physical cores on this host. If you had three virtual machines on this host, each with 4 virtual cores, then you would have 12 total cores assigned; leaving you with a ratio of 1:1 (virtual cores : physical cores). If you were to increase the number of cores per VM from 4 to 8 then your ratio would change to 2:1 and you would be introducing at least some level of CPU contention.
Note: You should also leave processor cores available for the Hypervisor OS itself, but for this example I excluded that measure for simplicity.
Again, in vendor-neutral layman’s terms, when your ratio exceeds 1:1 (2:1, 3:1, 4:1, etc.) a VMs likelihood of having to wait for a physical core to become available for its use increases. Check out the above links for detailed explanations of this.
It depends (a Consultant’s favorite answer). In many cases, overcommitting CPUs is perfectly acceptable & recommended; in fact I’d say it’s one of the biggest advantages of virtualization. Though it really does depend on the workload; solutions like VDI can go beyond 12:1 (depending on which vendor you speak to) & still achieve acceptable performance.
But in the Exchange world, Microsoft makes their stance pretty clear. They will support a ratio no greater than 2:1 of virtual processors to physical cores; however, 1:1 is strongly recommended. VMware echoes this statement. Also, hyperthreading can be enabled on the host, but when sizing you should only take into account the physical cores. In short, size as if HT is not enabled.
While going through my VCP training my instructor used an analogy that’s stuck with me for a while. People have this misconception about hyperthreading that it’s actually giving you twice the cores when it’s not. Say you’re eating food with one hand; you’re losing the opportunity to put more food in your mouth in the time that it takes to reach down & grab another bite. Now if you could eat with both hands (enabling HT) then during that time when one hand is getting more food, the other hand could be putting food in your mouth. However, you still ultimately have only one mouth to eat with. And most importantly, the faster you’re eating (moving your hand back & forth) then the less benefit that other hand is giving you. So on a server, the more utilized the processors are, the less benefit HT will give you. So it’s not accurate to say that HT gives you twice the cores because it does not; but it can increase performance in some situations.
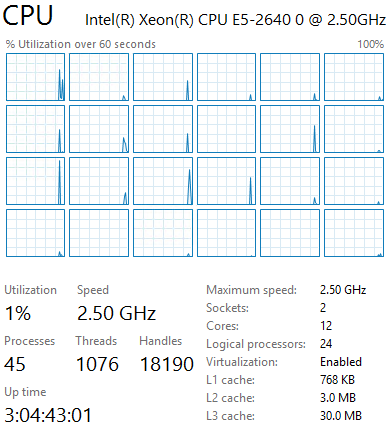
Here I have a Server 2012 R2 Hyper-V host with 2 Intel Xeon processors with a total of 12 cores. For this example, Hyperthreading will be enabled, meaning the Windows OS will see 24 cores (or Logical Processors).
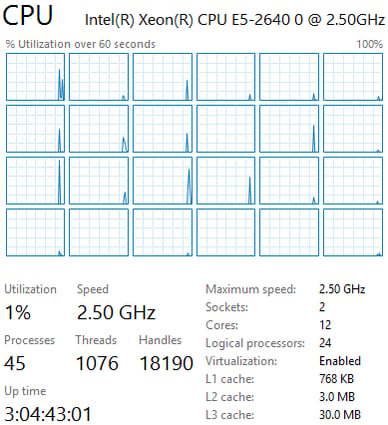
As previously mentioned, while I see 24 Logical Processors, I should be sizing as if there are only 12 (because there ARE only 12 physical cores).
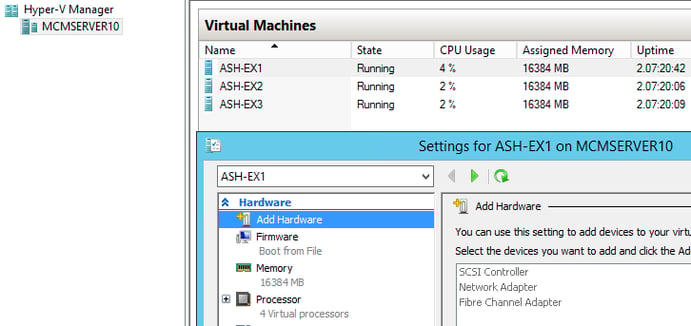
On this Hyper-V host I have 3 Exchange 2013 servers with matching configurations: 4 virtual processors assigned & 16 GB of static RAM (64GB of RAM on the host).
Now here’s a very cool performance counter that was introduced in Server 2012 Hyper-V. It’s Hyper-V Hypervisor Virtual Processor\CPU Wait Timer Per Dispatch. This is as close as we can get to a Hyper-V equalvalent of VMware’s CPU Ready (see links above).
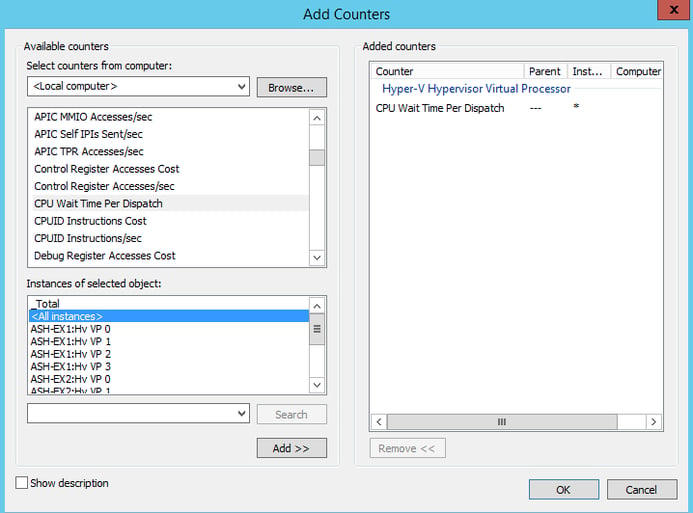
Not much has been written about this extremely useful counter, except just acknowledging its existence.
Hyper-V Equivalent to VMware CPU Ready Time
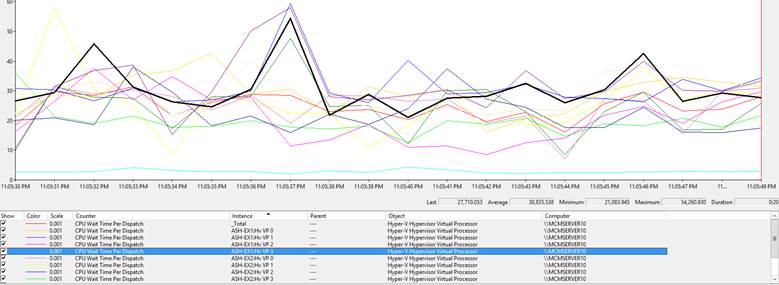
This counter gives us the time in nanoseconds (1,000,000 nanoseconds=1 milliseconds) that the virtual processors for each VM had to wait for a Logical Processor to become available so it could execute a task. Below are the values for our current configuration with a 1:1 ratio of assigned virtual cores to actual physical cores (see image). In my testing I’ve found there’s a certain level of overhead that causes us to typically see an average somewhere between 15,000ns & 30,000ns (I feel ESX does a better job of this than Hyper-V, though I haven’t tested with Hyper-V Core). We’ll always see spikes at times but nothing more than about 60,000ns. This is with a moderate workload running against the Exchange VMs (roughly 50% CPU utilization).
Now if we look at these same counters after reconfiguring each of the VMs to have 24 virtual processors, we’ll see a much different picture. That’s 72 total virtual processors assigned, a ratio of 6:1! (72 cores assigned on a host with only 12 physical cores)
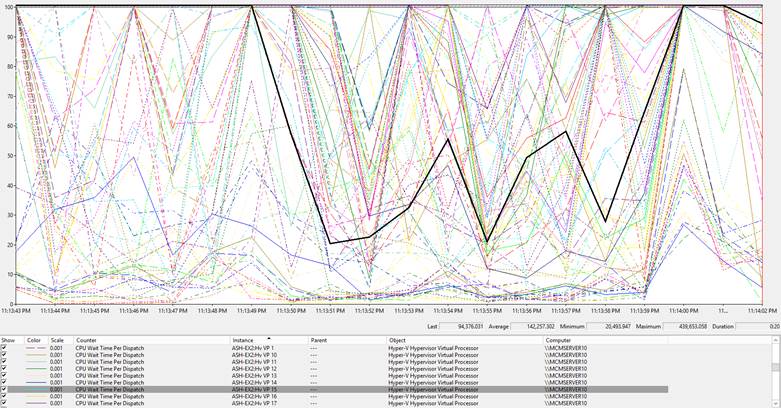
We can easily see that for the majority of our vCPUs, our average jumped from around 30,000ns to well over 100,000ns with the same workload. Also, our spikes have jumped from the 50,000ns to 400,000ns. Imagine what this would look like with heavy load on the Exchange Server!
The most interesting thing about troubleshooting a system that’s experiencing CPU contention is that from within the VM itself, CPU utilization may be minimal; yet things are painfully slow still. Much of this will depend on the load of the host, workload within your VM, & the sizing of the other VM’s. A few very dense VM’s like my example, or many small VM’s with only 1-2 vCPUs can have differing behaviors.
The important thing to remember is not to jump to conclusions & start adding cores because you think it needs them. If you’ve been paying attention you’ll understand that it will only make it worse as the VM may have to wait longer for its additional vCPUs to be scheduled against physical cores that are heavily utilized.
Simply put, if your CPU is fully utilized within the VM, then you may look at increasing vCPUs. If you suspect processor but the vCPU within the VM isn’t pegged then investigate possible CPU contention.
It’s important to realize how easily this can happen without proper operational controls. I had a case where an Exchange 2010 customer experienced a period of heavy mail flow but the mail queues were not draining. The root cause was a junior virtualization admin moved several dense VMs to the same host as Exchange & took it from a 2:1 core ratio to 6:1.
Earlier we saw our CPU Wait Time Per Dispatch numbers jump from a 30ms average to over 100ms, but what do these numbers mean & has Microsoft published acceptable values for these counters?
The short answer is no, at least not that I could find. However, VMware does have many public references as to what is deemed acceptable; however, they use a percentage.
VMware by default takes a 20 second capture interval & provides a summation of time spent in Ready state. So you might find a value of 1500ms for a 20 second capture period. To get to a percentage you would simply take the 1500ms value & divide it by the amount of milliseconds in the 20 second capture period (20,000); then multiply by 100 to get a percentage of 7.5%. A VMware VCDX listed the recommendations below on his blog post titled How much CPU ready is OK?
<2.5% CPU Ready
Generally No Problem!
2.5%-5% CPU Ready
Minimal contention that should be monitored during peak times
5%-10% CPU Ready
Significant Contention that should be investigated & addressed
>10% CPU Ready
Serious Contention to be investigated & addressed ASAP!
So how do we get these numbers from our Hyper-V counters? The method I chose was to simply change my performance monitor sample interval to 1 second & duration to 20 seconds (in an effort to align with the VMware realtime metric). Remember, VMware uses a summation of all time spent in Ready state during the 20 second duration, we don’t have a summation option in Performance Monitor. So what we’ll do is after capturing the data for 20 seconds, take the average value & multiply it by 20; giving us a rough summation of time spent in “Ready” state for that 20 second period. At this point all we have to do is divide by 20,000 & then multiply the result by 100 to get a percentage. Confused? Let’s use the last Performance Monitor output above as an example:
For ASH-EX2 Virtual Processor 15, the average time spent waiting was 142,000ns (.142ms) in a duration of 20 seconds. Multiplying .142 by 20 gives us a total ready time of 2.84ms during that span of 20 seconds (20,000ms). If we divide 2.84 by 20,000 & then multiply the result by 100 we’ll get a “%Ready” of .014% for that virtual CPU (which is considerably higher than before, though not horrible). Whatever thread that vCPU was running had to spend 4X time waiting than before we overcommitted.
Here’s the configuration steps with this calculation expressed as an equation:
Configure Performance Monitor for a sample interval of 1 second & a duration of 20 seconds.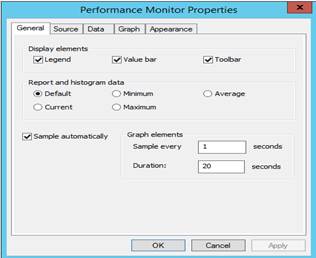
After 20 seconds, pause the capture & use the below equations:![]()
![]()