
Active Directory Monitoring: AD Time Service

Is time, or more precisely an accurate time, necessary to operate an IT infrastructure? Well, it...


In the previous blog article “The Active Directory Time Service – Part 1: AD Monitoring basics of W32time”, we discussed how Network Time Protocol (NTP) and the Windows Time Service work within Active Directory and why they are critical components of Active Directory Monitoring. In this next part, we will learn about how to configure NTP time sync both manually and by using Group Policy. Before we go and make any changes, we need to check the current settings.
Go to any domain member to verify domain time synchronization settings using the registry editor at HKLM\System\CurrentControlSet\Services\W32Time\Parameters\Type:
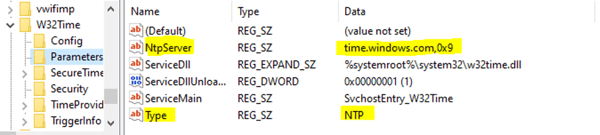
Non domain-joined workstation
If you see the value “NTP”, then the computer is synchronizing with the value of NtpServer, which in this case is time.windows.com.
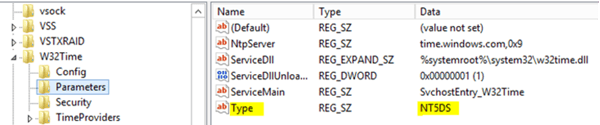
Domain-joined workstation
If you see the value “NT5DS”, the computer is synchronizing with the Active Directory time hierarchy.
On the domain controller side, you need to be monitoring Event logs and verifying the settings for the Windows Time service. These event logs are enabled by default and can be found in the event viewer under the Applications and Services Log\Microsoft\Windows\Time-Service\Operational channel. The following is a list of the Windows events that are logged regarding the Windows Time service that should be monitored with your AD monitoring solution.
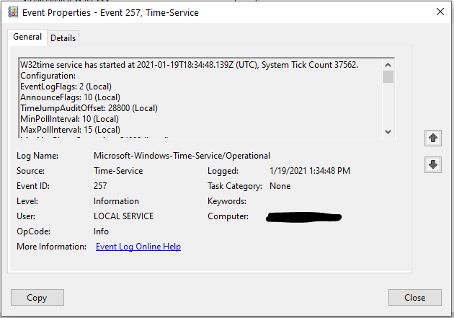
Event 257 – Service Start
When the Windows Time Service is started either manually or by Windows itself, the information about the current time, current tick count, runtime configuration, time providers, and current clock rate are logged and displayed.
This information can also be retrieved by using either of the following commands:
Clock rate:
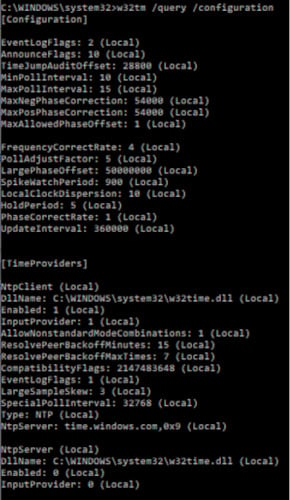
- exe /query /status /verboseW32Time and time provider information
- exe /query /configuration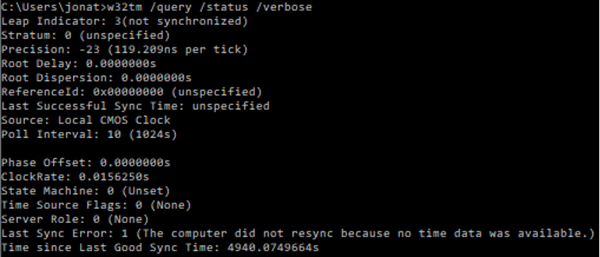
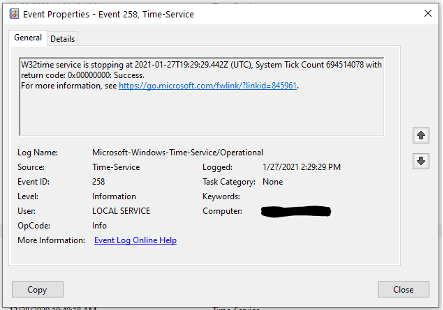
Event 258 – Service Stop
We see this event whenever the Windows time service is stopped. It will log information about current time and the tick count.
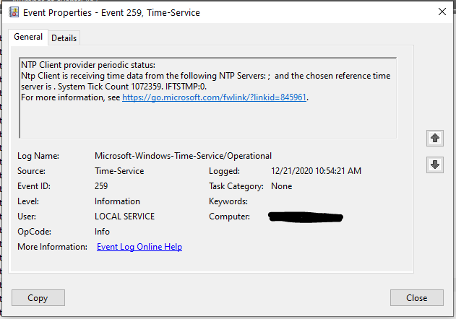
Event 259 – NTP Client Provider Periodic Status
Every eight hours the list of time sources will be logged by the system. This will include the available time sources, the reference time server in use (remember more than one can be logged), and the current tick count.
This information can also be retrieved manually by using this command
- exe /query /peers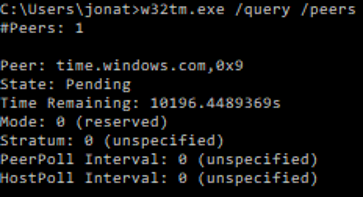
Event 260 – Time service configuration and status
An event that is logged once every eight hours that includes the Windows Time service configuration and status. This event is almost the same as event 257 except this event is run periodically after the service has already started.
This information can also be retrieved by using either of the following commands:
- exe /query /status /verbose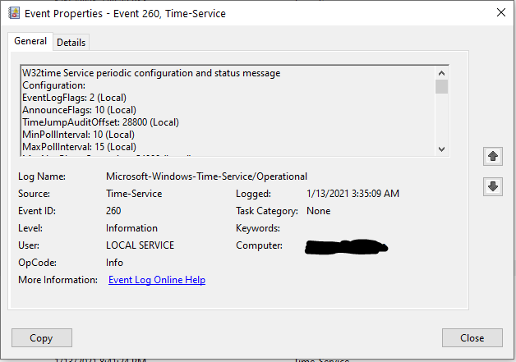
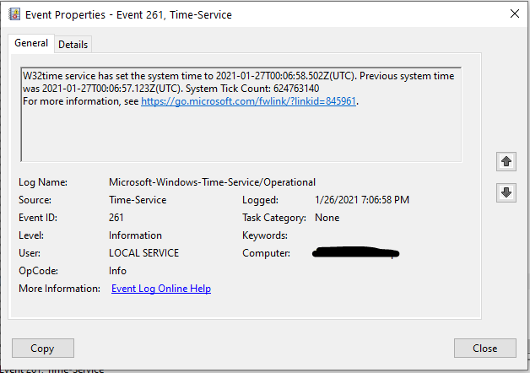
Event 261 – System time is set
This event is logged whenever the System Time is modified using the SetSystemTime API. Although this event should rarely occur, you will want it logged each time it happens as it gives insight as to the health of your time synchronization.
Event 262 - System clock frequency adjusted
W32time modifies the system clock frequency. Any time an adjustment is made that appears “reasonable significant” (Microsoft’s words) it will log the event. These adjustments happen all the time below the threshold so you will not see this event often. That is above min = 128 part per million, default = 800 part per million. The event will only get logged when a clock adjustment is above TimeAdjustmentAuditThreshold values. You can create finer tracking so you can adjust the setting down.
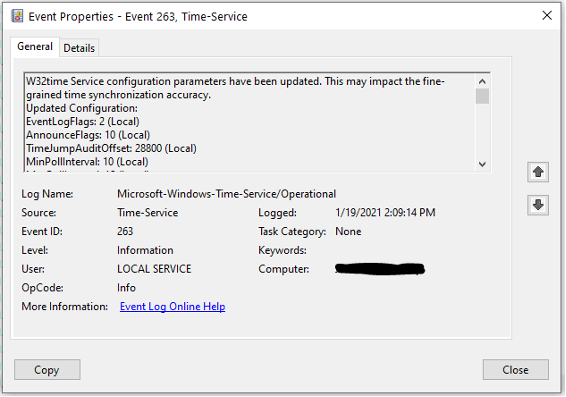
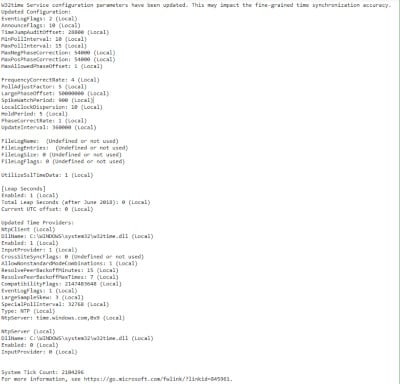
Event 263 - Change in the Time service settings or list of loaded time providers
This event happens when either an administrator or group policy has updated the time providers and restarts W32time. This is a critical piece of your AD monitoring of time synchronization because someone, somewhere has changed the time provider settings on either a PDC emulator or a domain or workgroup member client. When this occurs, it can also have a potential impact on your time synchronization because re-reading this critical setting is causing the setting to be modified in-memory. This can affect the overall accuracy of your time synchronization.
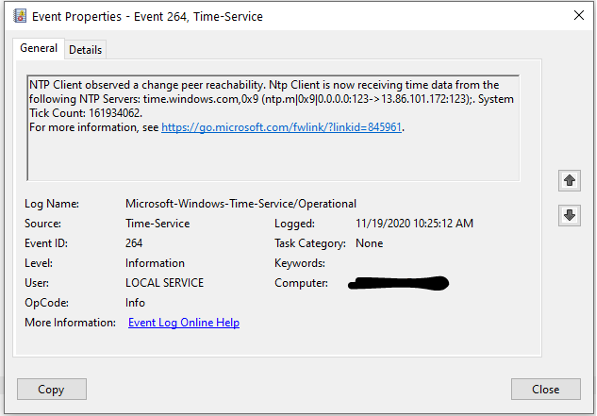
Event 264 - Change in time source(s) used by NTP Client
The NTP client records this event when the time server or peer changes its state (when a synchronization is pending, or the timeserver or peer is unreachable). This event happens at a maximum of once every 5 minutes. Any more often than that and the log may be prone to transient issues or bad provider information.
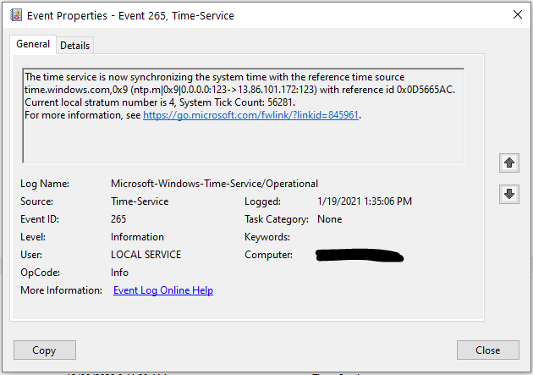
Event 265 - Time service source or stratum number changes
This event is regarded by some to be the most critical when monitoring your NTP topology. Any changes to the W32time time source or stratum number need to be logged and monitored by your AD monitoring solution. Any time that a time source is removed (or not present), the server will stop acting as a time server and cease advertisement of such. All requests for time synchronization will be ignored and even possibly respond with invalid parameters.
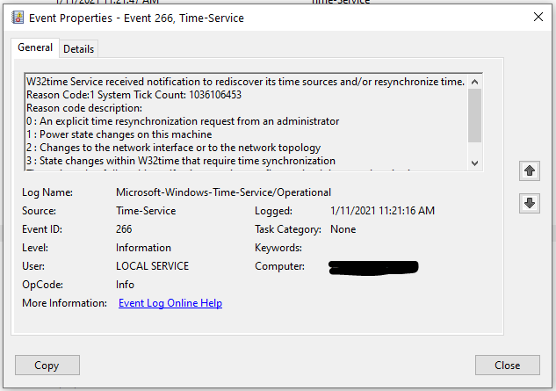
Event 266 - Time re-synchronization is requested
This event is logged at a maximum of once every five minutes. There are many possible causes for this event to occur:
- An administrator has issued a resynch commandThere would be an immediate loss of any fine-grained time synchronization accuracy since the NTP client needs to clear its filters. This event is throttled by the system because any time you have a bad network connection (cable/card) this can trigger multiple events and overwhelm your logs.

Over the last two article we have covered what needs to be in place for Active Directory monitoring in your enterprise environment. On every PDC Emulator we need to be checking firewall UDP port 123, making sure all network elements are working as they should be, and monitoring for any events that may be logged to ensure that any changes to you W32time service are recorded and addressed accordingly. Please stay tuned for more AD monitoring articles to help you address any and all issues with your AD environment.
Active Directory as the foundation of your network, and the structure that controls access to some of the most critical resources in your organization. ENow uncovers cracks in your Active Directory that can cause a security breach or poor end user experience. In particular, ENow enables you to:
- Report on highly privileged groups (domain admins)Don’t take our word for it. Start your free trial today!