Are You Using TMG and Having Issues Publishing Outlook Anywhere?

Ever tried to publish Outlook Anywhere using NTLM with TMG and use Kerberos Constrained Delegation?...


Editor's Note: Originally posted by Paul Cunningham (Microsoft MVP) on his blog, Practical365, this review is extremely comprehensive and discusses the many ways Mailscape can be used for Monitoring and Reporting of your on-prem environment.
When I give conference talks about Exchange Server, there are two stories that I like to tell. The first story is about the company that hired me to join their IT ops team as an Exchange specialist. Within the first week I’d learned that the Exchange environment was highly unstable. The DAG had database failovers at all hours of the day and night for unknown reasons. The second story is an education institute that I consulted to. A review of their quite large Exchange environment revealed many of their client access servers had multiple failed protocols that had gone unnoticed.
In both of those cases the Exchange system was able to do its job most of the time. The users had email service with few incidents of significant impact. You could argue that one of the strengths of Exchange Server is its ability to soldier on despite underlying problems. But that doesn’t change the fact that it’s not an ideal situation, especially when small problems accumulate and cause major outages. And let's be honest, fixing long-standing issues like I found in those two customer environments takes quite a lot of work. Many hours were spent to investigate issues, and then make changes to fix them. Obviously, it's better to avoid the issues in the first place.
That is where monitoring systems come in to the picture. The promise of most monitoring systems is that they provide a complete solution with broad coverage and accurate alerts. The reality is often different, for several reasons. First, most monitoring systems are extremely complex and difficult to set up. They provide no real benefit without pouring hundreds of hours into installing and tuning their configuration.
Secondly, most monitoring systems sacrifice depth of monitoring for breadth of coverage. Sure, they can check everything from your network switches to your domain controllers. But they often lack the visibility into your infrastructure that allows them to alert you to what actually matters. In my earlier examples, both customers were running well-known monitoring solutions. But neither of their solutions were able to show them what was wrong with the Exchange servers.
Mailscape is a monitoring and reporting system for on-premises Microsoft Exchange Server environments. Created by ENow Software, Mailscape is designed to deliver a monitoring solution that is easy to install, provides quick wins, and gives you real alerting without all the false positives. ENow started as an Exchange consulting company, and it was their experience out in the field that lead to the creation of the Mailscape product in order to gain a better understanding of their customers’ environments. Mailscape has won a stack of awards, and is used by customers around the world, including some of the world’s biggest brands. In this article, I’m going to take a closer look at how Mailscape delivers on its promise of simple, reliable monitoring and reporting for Exchange.
I recently reviewed Mailscape 365, which is ENow’s monitoring product for cloud and hybrid environments. If you read that review along with this one, then you’ll notice that Mailscape and Mailscape 365 are very similar looking products. The two products share many design elements, and in some areas the two products work the same way. If you have both products deployed, they even integrate into the same unified dashboard. But they are two separate products. Mailscape was developed before Mailscape 365, and has matured over several years based on input from several Microsoft MVPs, as well as customer feedback.
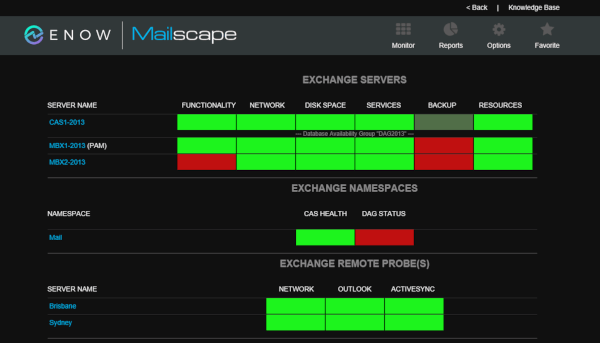
Mailscape does away with the confusion of most monitoring dashboards and takes a visual approach by utilizing a simple traffic light system. The aim is to provide simple, visual clues for the health of your Exchange environment. Red is bad, yellow is a warning, green is good.
Once Mailscape has drawn your attention to a problem, it then provides you with an easy way to drill down into the issue and identify the root cause. As we all know, troubleshooting is a game of elimination. To solve a problem, you need to understand the product itself, and how it is implemented in your environment. Then you need to consider all the possible conditions that might be causing a problem, and investigate each one to find the root cause. The ENow team call this “trimming the troubleshooting tree”, and when you see how Mailscape works you understand why.
Consider a typical support case. One or more end users contact the help desk to complain of a problem with their email. The help desk spends time eliminating basic causes (e.g. restarting Outlook, restarting the computer, checking for locked accounts, sending test emails). When they exhaust their knowledge, they escalate to the next support tier. The second level support person runs their own troubleshooting, which might include repeating the same steps as the help desk (let’s be honest, we’ve all done this). They'll open PowerShell and run diagnostic commands. Meanwhile, more users are complaining of email issues, and each report is being analyzed to see if it is a unique issue or the same issue that is already under investigation.
I’ve been in those situations myself, so I’m not being critical of anyone here. That’s just the reality for many support teams who don’t have a monitoring system in place that is actually adding value to their incident response.
When you add Mailscape to the mix, the story changes. The product provides the ability to have custom dashboards for each functional group in your organization. When the help desk receives the first support call they can look at the Mailscape dashboard and see whether there are any red or yellow indicators. They can click on alerts and see more details about the problem, such as the MAPI connectivity issue shown below.
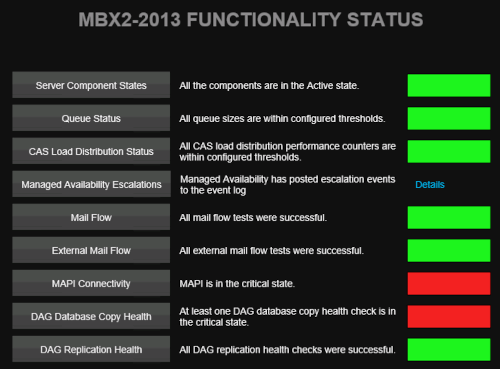
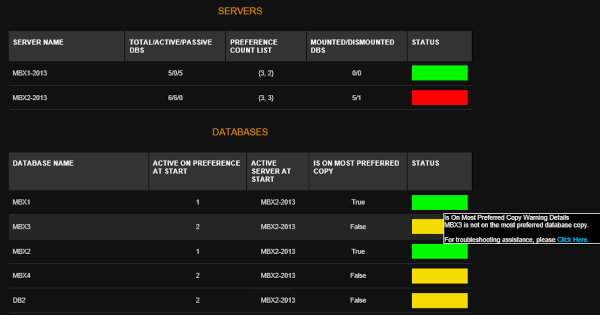
They can drill down even further to find the cause of the MAPI connectivity problem, which in the case below is due to a database problem.
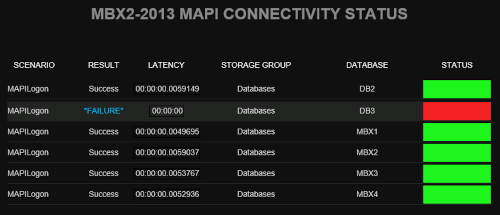
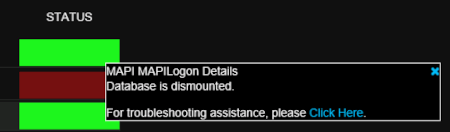
Any by clicking on the database alert, they can see the root cause of the alert is that the database is dismounted.
So, within seconds the help desk is able to correlate a user reported issue with an actual problem in the Exchange environment. They can escalate to the appropriate support team faster and with more relevant information at hand.
The Mailscape traffic light system is unique. But what’s happening behind the scenes to give you that view of your Exchange landscape?
To begin with, yes you get traditional server monitoring features such as disk space, CPU, and memory usage. The data for these is collected by remote monitoring agents that you deploy to your servers.
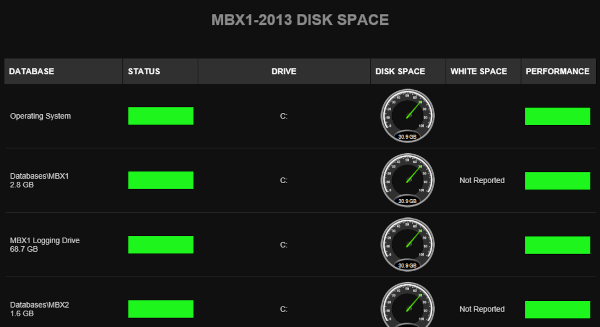
Typical Exchange monitoring of metrics such as database backups, transport queue sizes and database copy queues are also included. These are the sort of things that Exchange admins need to check whenever there’s a problem, such as users reporting that emails they’re expecting to receive haven’t shown up yet. Instead of digging into PowerShell cmdlets and event logs, obvious problems like back pressure will be detected and alerted by Mailscape.
Mailscape also uses remote probes to generate synthetic transactions that simulate user activities. Where traditional monitoring systems look for stopped services, or dismounted databases, Mailscape is able to use its synthetic transactions to actually test the availability and health of specific Exchange components. A good example is the Outlook Web Access health alert in the screenshot below. To create that alert I stopped the MSExchangeOWAppPool in IIS. A few moments later, Mailscape is showing an alert in the main dashboard for client functionality. Drilling down into the alert details takes you to the view of the CAS protocols showing OWA as unhealthy.
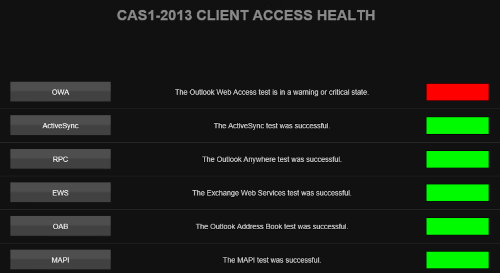
After I started the app pool again the Mailscape monitor returned to a green status within a few minutes.
The Mailscape remote probes can be deployed throughout your network to provide more context into issues in your environment. Let’s say you have a datacenter or two that host your Exchange DAG, but dozens of remote sites where the clients are connecting from. Remote connectivity to Exchange relies on good network connections, which could be supplied by multiple vendors. Network engineers also love to add things into the picture such as wan optimizers to try and squeeze the most performance out of the links, and security folks love to put firewalls and packet inspectors in the way as well. Any of those can cause problems with client connectivity, and remote probes are what gives you the view from your remote sites that will help you to narrow in on network issues vs server-side issues.
Mailscape’s monitoring of client access is more than just per-server awareness. In high availability environments, there are more moving parts involved, such as load balancers, multiple namespaces for different regional datacenters, and maybe even geo-DNS. Even if your Exchange servers are completely healthy, the Exchange service can be impacted if a lad balancer configuration error occurs, or a mistake is made with a DNS change. Within Mailscape you can define specific DNS namespaces to monitor, so that it alerts you to problems with those extra moving parts as well.
Aside from Exchange service availability, Mailscape can also alert you to overloaded servers. These are usually identifiable by excessively high client requests. Collecting that data in Perfmon is a pretty tedious job. Interpreting the data is quite difficult as well. And of course, you only get data from the time you start running Perfmon, so you lose visibility into the history of a performance issue.
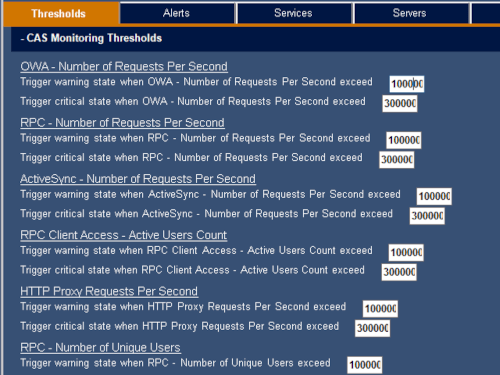
The thresholds for what is considered over-utilization are configurable in the Mailscape admin interface. In fact, extensive tuning is available for all of the Mailscape monitors.
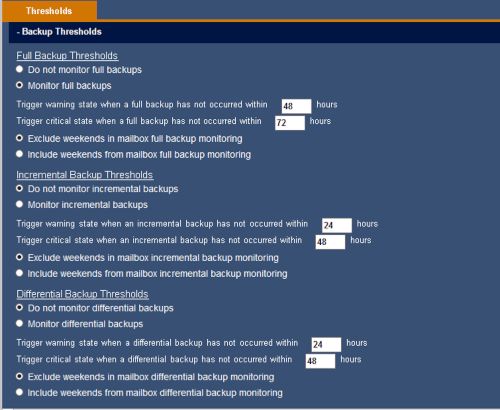
Backups are a good example of tuning that actually helps you remove unwanted alerts. Knowing about failed backups is important, but one failed backup is often not a cause for alarm. In a lot of cases, the next backup runs successfully and the problem is resolved. However, two failed backups are a cause for alarm, because that indicates something may be wrong with the backup system or with the Exchange mailbox database itself. In Mailscape you can tune the backup alert thresholds to avoid those unwanted alerts, but still be alerted when multiple backups have failed.
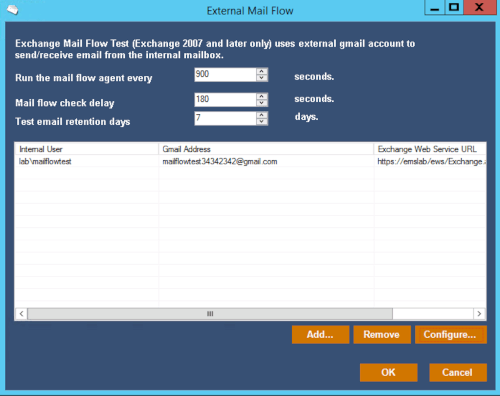
I also like the external mail flow test that Mailscape performs. All you need is a Gmail address set up to auto-reply to emails from Mailscape. Your Mailscape server is then configured to send a test email to the Gmail address. Mailscape watches the designated Exchange mailbox for the auto-reply to arrive. It’s a simple test, but very important because so many external mail flow problems go undetected for a long time before someone notices that they haven’t received any external emails in a while. And many external mail flow issues aren’t actually caused by Exchange problems that you can detect by monitoring Exchange itself. A firewall issue, or a DNS issue, can easily cause mail flow to break even if your Exchange servers are completely healthy. So as with the synthetic tests for client access issues, the mail flow test is a feature of Mailscape that adds a lot of value.
The speed of alerting raises an interesting point about how Mailscape fits into the Exchange world. Now that we have Managed Availability for Exchange 2013 and later, what's the point of monitoring Exchange?
As a quick overview, Managed Availability is a built-in health monitoring and remediation service for Exchange. It uses its own synthetic transactions and health probes to detect faults, and then initiates recovery actions when a problem is detected. Managed Availability was created to allow Microsoft to run Exchange at the scale of Office 365. It's useful for on-premises servers as well, but is somewhat of a “black box”. Many administrators are still uncomfortable with what Managed Availability is silently doing to their servers.
Mailscape works alongside Managed Availability in a few different ways. First, Mailscape is aware of servers being placed into what is known as “maintenance mode”. Exchange admins place servers into maintenance mode to effectively disable Managed Availability and keep it from interfering during routine maintenance, such as when installing patches and updates on the server. When you place an Exchange server into maintenance mode, Mailscape recognizes it as well and will stop alerting for that server. This is in addition to Mailscape's own “maintenance mode” which you can enable when you need to suppress alerting for a server.
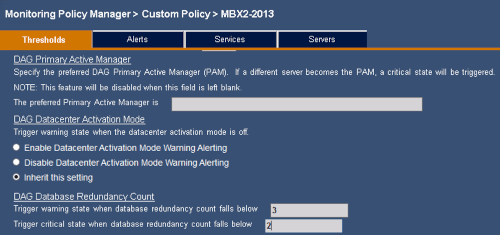
The second way that Mailscape gets along with Managed Availability is through the use of alert thresholds. Consider a well-designed Exchange environment that has a database availability group that hosts four copies of each mailbox database. At any given time there could be an issue with the health of one of the passive database copies; anything from an unhealthy content index to a full-blown loss of the database copy due to underlying storage failure. That would leave three out of four database copies still available. Not a major concern, especially if you have auto-reseed configured.
During auto-reseed, which is a Managed Availability recovery process that uses a spare disk volume to replace the failed storage and then reseed the failed database copy, you would not want to get an alert from Mailscape about the failed database copy. Instead, you would want to allow Managed Availability to do its job and complete the recovery action.
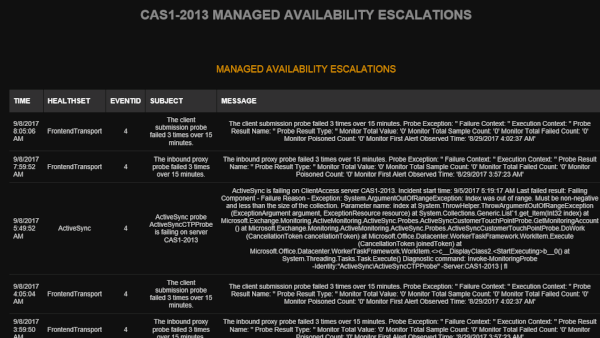
Finally, Mailscape also provides you with a view of the Managed Availability escalations for a server. This takes Managed Availability out of the black box that it usually hides in, and makes you aware of what it is actually doing behind the scenes, such as cycling services or restarting servers. If you’ve ever had to open event viewer and dig into the crimson channel on a server to hunt for Managed Availability events, then you’ll appreciate this simple and easy to access view in Mailscape.
Although Managed Availability works for single mailbox servers, it was primarily developed for keeping Exchange database availability groups working. As anyone who has supported a DAG knows, they can be a real challenge to keep an eye on. Even a well-designed DAG is going to have problems. In fact, Managed Availability was developed on the basis that problems are never 100% avoidable.
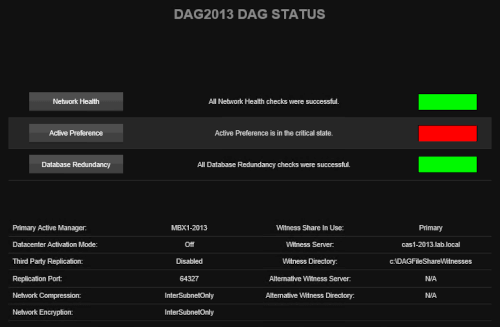
It’s quite challenging to keep DAGs healthy without a good monitoring tool helping you out. Mailscape shines in this area. The DAG health status view in Mailscape tells you everything you really need to know. You get health information, as well as the configuration information that is good to have on hand without needing to drop into a PowerShell session.
In terms of database copy health, Mailscape will alert you to critical issues such as databases dismounted, failed copies, failed content indexes, and also issues of a less critical nature such as databases not being active on the preferred copy. The preferred copy check would have been very useful in the environment I was working in where unexpected failovers were a daily occurrence. When I started working there the only way the database failovers were noticed was when they caused the nightly backup job to fail, because the backup software depended on a specific active database layout. I ended up writing a PowerShell script to gain more visibility into the database copy status, and that custom script cost a lot of hours to develop. It’s one of those perfect examples of a lack of investment in one area (monitoring) resulting in higher costs elsewhere (my time spent developing a custom script).
My custom PowerShell scripts have tens of thousands of downloads, and I regularly get feedback from Exchange admins letting me know about the problems that the scripts found in seemingly healthy DAGs. But despite the time I’ve invested into them, the scripts still aren’t written with anywhere near the depth of coverage that Mailscape has, and they’re only intended as a zero-dollar solution for people with no budget for monitoring tools. Overall the DAG monitoring in Mailscape is a real highlight.
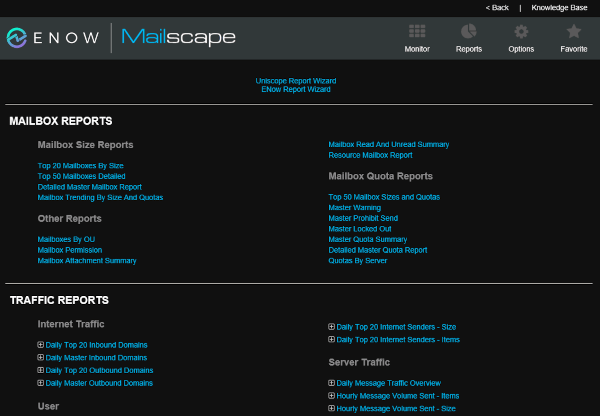
The monitoring capabilities of Mailscape provide a lot of value, but there is also a reporting feature included. It’s unusual to find a monitoring tool that does reporting well, or a reporting tool that does monitoring well. Mailscape somehow manage to do both well, which I suspect is due to their focus on Exchange Server.
There are over 250 reports included with Mailscape. On the chance that you aren’t satisfied with that many, you can also create your own custom reports. You can also plug your own reporting tools into the SQL database that stores the data Mailscape has collected. Mailscape also allows you to write your own PowerShell scripts to pull reporting data from Exchange. Mailscape then handles the scheduling of your custom PowerShell, and the display of the data through the Mailscape reporting interface. In effect, this means you can combine Mailscape reports with your own custom data in a single dashboard that you provide to stakeholders in your organization.
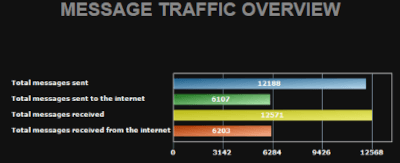
As any seasoned admin will tell you, Exchange is pretty good at providing useful log data for reports, but has absolutely nothing to help you create the reports. Believe me, I have the battle scars from years of pulling reports together by scraping message tracking logs, or IIS logs, or protocol logs. I've spent as much time in Excel manipulating CSV files as I have in the Exchange Management Shell. IT managers love to ask questions like how many emails are sent internally vs externally. Parsing through gigabytes of message tracking logs to answer those questions is not an easy task, especially when the request is for historical data that you no longer have logs for. So, I’m quite pleased to see internal and external traffic reports built in to Mailscape.
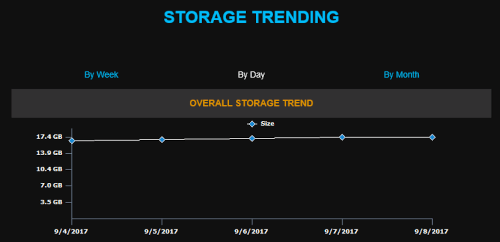
There are also executive overview reports, with nice summary data such as the number of mailboxes and the amount of storage being used.
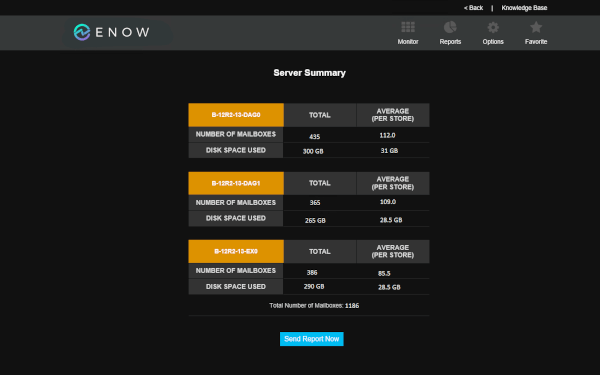
Notice that timestamp and button at the bottom of the screenshot above? That’s how Mailscape lets you get the most up to date information in its reports. Ever had to send a manager a report of mailbox sizes or storage usage, only to get a request for updated figures a few days later? With Mailscape there's no need to collect the data and send it again. Your manager can just go see the latest numbers in their own custom Mailscape dashboard any time they need to.
Among the Mailscape reports are all the popular reports such as mailbox sizes, mailboxes breaching quotas, Outlook versions, mobile device users, login times, and traffic stats. There are also some real gems, like the inactive distribution lists report, empty public folder report, and a series of Exchange auditing reports for activities such as delegate mailbox access and send-on-behalf. Again, all these reports are able to be created manually using scripts and log parsing, but it’s incredibly time consuming and tedious to do so, not to mention inaccurate if you don’t know what you’re doing.
The Mailscape reports don’t need any special admin privileges in Exchange, so they can be accessed by non-technical staff. The reports can also be restricted to specific audiences, for example if you have teams in different parts of the world that shouldn’t see reporting data for other regions.
I always advocate for customers who need more than occasional ad-hoc reporting from Exchange to invest in a proper reporting tool like Mailscape.
There’s been a bit of noise in recent years about the death of email. That is partly due to instant messaging and other chat services like Slack or Microsoft Teams growing in usage. It also has a lot to do with the utility nature of email these days. People don’t think about email as an exciting communications channel. Instead, they just expect email to work. It’s that user expectation that makes us work hard to build stable, reliable Exchange Server environments that our users can depend on. And a key component of running a reliable email system is having a monitoring product that helps you to keep Exchange healthy and available.
During my evaluation, the only time I needed to call on ENow support was when I couldn’t locate some of the tuning options in the back-end admin screens. Although Mailscape gives you a lot of quick wins straight away, many more than other products that I’ve tested, the configuration back end was a bit confusing at first. I imagine that many admins would need to call on ENow support during that initial tuning phase to get the monitoring policies working just right. Fortunately, ENow support were quick to respond to my questions. And most of what you see in the back-end is “set and forget” anyway.
So, who would benefit the most by deploying Mailscape? Large, complex environments are an obvious candidate. When there’s so much infrastructure to keep an eye on, human operators need help. But it’s not just a question of scale. A small team with broad responsibilities in a smaller environment needs the same help as a dedicated messaging team in a larger environment.
The hours invested to build and maintain custom toolset that fills in the gaps left by most monitoring solutions are just not an efficient use of time. Take it from me, I’ve been there many times in the past.
On-premises components, such as AD FS, PTA, and Exchange Hybrid are critical for Office 365 end user experience. In addition, something as trivial as expiring Exchange or AD FS certificates can certainly lead to unexpected outages. By proactively monitoring hybrid components, ENow gives you early warnings where hybrid components are reaching a critical state, or even for an upcoming expiring certificate. Knowing immediately when a problem happens, where the fault lies, and why the issue has occurred, ensures that any outages are detected and solved as quickly as possible.
Access your free 14-day trial of ENow’s Exchange Hybrid and Office 365 Monitoring and Reporting today!


Now that you've looked over part 1's information on how to build a SCCM report of let's proceed...