Exchange Managed Availability: What a Green Dashboard Misses

Exchange Managed Availability: your server monitors itself, and nobody is watching.
You know the...


In the previous article, we looked at why an "all green" dashboard doesn't guarantee a healthy Exchange environment. We touched on alert fatigue there. It deserves its own deep dive, so here it is.
Alert fatigue looks like a minor annoyance, another cluttered inbox. It's actually a serious operational risk: important alerts get lost in the noise, and too much monitoring becomes just as ineffective as too little.
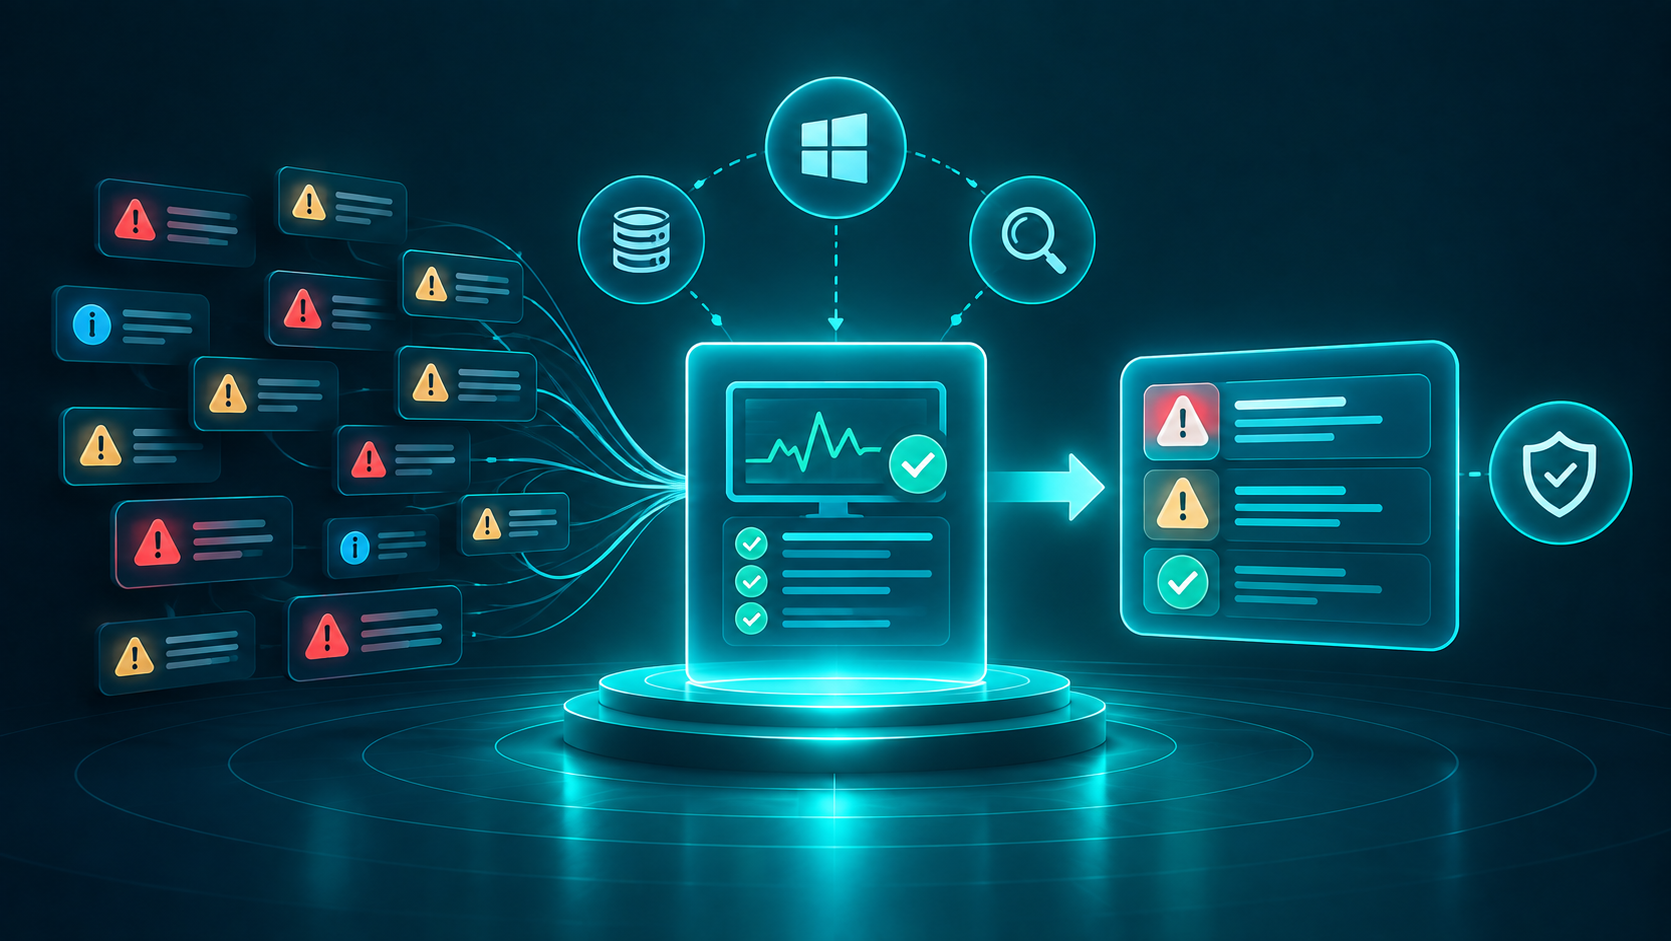
It usually starts with good intentions. When a new monitoring tool goes in, thresholds get set conservatively low, just to be safe. The thinking is that it's better to get too many alerts than too few. Many organizations also run multiple monitoring layers at once: infrastructure monitoring through SCOM, log analysis via Splunk, and native Health Sets from Managed Availability. Each layer has its own view of the environment and its own criteria for firing an alert.
Many administrators recognize this scenario. A brief restart of a transport service can trigger multiple alerts from different sources. SCOM reports the service status, Splunk highlights relevant logs, and Managed Availability logs its Health Set entries simultaneously. A single event can generate three notifications across systems. Without active correlation, this often creates the impression of multiple issues, though there is actually only one.
Over time, this adds up. Inboxes fill with notifications, dashboards sit permanently yellow or red, and Teams channels for alerts turn into constant background noise. That's the point where alert fatigue sets in.
It may seem counterintuitive, but having too many alerts can be more dangerous than having too few. A person with no monitoring at all simply knows they're operating blindly and tends to act cautiously. However, someone overwhelmed by numerous alerts will usually develop workarounds, most of which pose security risks.
The most common strategy is selective ignoring. When nine out of ten alerts turn out to be false positives or minor side notes, everyone eventually develops a reflex to skim notifications rather than read them. The problem here is obvious. The tenth alert, the one that's genuinely critical, looks at first glance exactly like the nine before it. It gets dismissed at the same speed.
Another common approach is to mute entire alert categories indiscriminately. When a warning repeatedly appears without justification, it is often turned off completely, frequently without any documented decision or checking if the threshold was simply set incorrectly. This not only eliminates the noise but also risks dismissing a legitimate alert that could have been important later.
Both strategies result in the same outcome: increased response times to actual incidents and decreased trust in the entire monitoring system. When nobody trusts the monitoring, it fails at its fundamental job, regardless of how technically advanced it is.
In more complex Exchange setups, the risk of alert storms increases. These are events in which a single trigger causes a flood of subsequent alerts. A common example occurs in DAG environments. If a network link between two data centers briefly drops, multiple database failovers might occur simultaneously. Each failover creates its own alerts, along with notifications about the network issue, DAG quorum warnings, and possibly Health Set alerts from Managed Availability. Within minutes, numerous alerts accumulate, but they all stem from a single, connected incident.
In hybrid environments, this issue is intensified by the connection between on-premises systems and Exchange Online. A certificate issue on the hybrid connector can cause alerts on the on-premises side, in Exchange Online, and within local transport monitoring, each with different wording and no clear connection. If these connections are not technically mapped, someone must mentally piece them together, which consumes valuable time during an active incident.
Correlation fixes this: group related events into one well-defined incident instead of showing twenty separate alerts for the same root cause.
It's essential to clearly distinguish root causes from symptoms, allowing admins to quickly identify where intervention is necessary.
A main way to reduce alert fatigue is through intentional threshold calibration that relies on actual data instead of cautious guesses. Setting thresholds "low just to be safe" often causes unnecessary noise. Instead, it's more effective to monitor the normal range of each metric over time and set thresholds according to that baseline.
Clear prioritization is essential. Not all deviations warrant the same urgency. For example, a short queue delay of a few minutes is very different from a mail flow halt lasting an hour, yet many systems treat both as equally urgent with loud notifications. Implementing a tiered escalation system, where minor issues are logged but not immediately escalated, and only critical ones trigger alerts, greatly reduces unnecessary noise while maintaining safety.
Finally, regular review is necessary. An alert that was relevant two years ago may now be outdated due to environmental changes. Those who never revisit their alert configurations tend to accumulate more rules over time, often leaving them unclear and difficult to explain.
★ QUICK ANSWER
Exchange alert fatigue happens when too many monitoring alerts train admins to ignore notifications, including the ones that
matter. Fix it by setting thresholds from real baseline data, tiering alerts by urgency, and correlating related events into one incident instead of many separate ones.
Outside your immediate environment, it's helpful to observe how the broader Exchange community handles alert calibration and monitoring strategies. Technical blogs and community forums offer insights into how other Exchange administrators have addressed the noise versus signal issue, which thresholds proved effective, and which monitoring configurations proved durable under real-world operational stress. Since alert fatigue largely hinges on the unique details of each environment, learning from peers' practical solutions often provides more value than generic best-practice lists.
Alert fatigue is an operational risk created by uncoordinated monitoring systems running in parallel. Correlation, calibration, and clarity on which alerts actually require action, that's what fixes it. ENow addresses this by consolidating related events into a single incident, rather than overwhelming you with numerous separate alerts that are actually part of the same issue.
In the next article of this series, we'll examine partial failures. Cases where Exchange is operational but not functioning as expected.
Alert fatigue is what happens when Exchange admins get so many monitoring notifications that they start skimming or ignoring them, including the alerts that actually matter. It usually builds up when multiple monitoring layers, such as SCOM, Splunk, and Managed Availability, each fire their own alert for the same underlying event.
An admin with no monitoring knows they're flying blind and acts cautiously. An admin buried in alerts develops workarounds like selective ignoring or muting entire categories, which can silence a genuinely critical alert without anyone noticing.
A single trigger, like a brief network drop between data centers, can cause multiple database failovers at once. Each failover generates its own alerts, plus DAG quorum warnings and possible Health Set alerts, so one connected incident looks like dozens of separate problems.
Track the normal range for each metric over time and set thresholds from that baseline instead of guessing low "to be safe." Pair that with tiered escalation, so minor deviations get logged but only genuinely critical issues trigger an alert.
Regularly. An alert that made sense two years ago may no longer fit a changed environment, and configurations that never get revisited tend to accumulate rules nobody can fully explain anymore.
More alerts don’t mean better monitoring. ENow helps Exchange and Microsoft 365 teams cut through monitoring noise so the alerts that reach your team are the ones worth investigating.
With Observation Mode and intelligent alert tuning, ENow analyzes alert behavior, identifies opportunities to reduce unnecessary noise, and helps you tune thresholds without sacrificing visibility into the issues that matter.
See how ENow can help you reduce alert fatigue and monitor Exchange with confidence.

Thomas Stensitzki is a Microsoft MVP, certified Exchange Server Master, and founder of Granikos GmbH & Co. KG, where he helps organizations modernize messaging, collaboration, and cloud security with Microsoft 365 and hybrid solutions. Alongside decades of deep technical expertise, Thomas has recently turned his focus to connecting technology with real-life conversations. He co-hosts the German-language podcast Cloudchroniken (https://cloudchroniken.de/), exploring the stories behind cloud technology, AI, and digital transformation. He also drives Discuss At Ease, an initiative inspired by his 2024 lymphoma diagnosis, creating open dialogue around illness, resilience, and well-being. A prolific speaker and trainer, Thomas shares insights at events like Experts Live and Exchange Summit. He contributes regularly to the Granikos blog, where his “Cumulative Update” series demystifies the latest in Exchange, Microsoft 365, Teams, and Copilot.

Exchange Managed Availability: your server monitors itself, and nobody is watching.
You know the...

Before we talk about Exchange Server's Managed Availability features, let's first remember the...