Dedicated Entra App Required for Exchange Hybrid - October 2025 Deadline

Microsoft is changing how hybrid authentication works between on-premises Exchange servers and...



Exchange Managed Availability: your server monitors itself, and nobody is watching.
You know the moment; your built-in monitoring dashboard shows no warnings. Everything is green. No alert, no ticket. And then someone from the business calls because email has been down for an hour.
Here is an important distinction. That green dashboard does not come from Exchange itself. Your monitoring dashboard reflects only what your monitoring solution is configured to check. Often, monitoring solutions use traditional system monitoring approaches. For example, they check the availability of an HTTP endpoint remotely. Some solutions use a locally installed agent to handle system-specific queries by executing script code. These solutions often ignore the fact that Exchange Server has its own monitoring solution: Managed Availability.
Managed Availability, sometimes referred to as Active Monitoring or Local Active Monitoring, is Exchange's internal system responsible for monitoring and self-healing. It does not have its own dashboard; instead, it runs silently in the background, without active notifications. The green status you see in your monitoring tool is an interpretation of the data collected by your monitoring solution, which may sometimes give a misleadingly complete picture.
Managed Availability was first introduced with Exchange Server 2013 and has been included in every subsequent Exchange deployment. The core idea is simple: Exchange should monitor its own health, identify issues, and attempt to fix them automatically whenever possible. In many cases, this happens before users become aware of any problems.
Technically, Managed Availability is built on three components:
Probes - active tests that Exchange runs against itself on a regular basis: Is a web service responding? Is a database connection working? Can Exchange reach an SMTP endpoint?
Monitors - evaluation components that aggregate probe results and derive an overall health state, organized into so-called Health Sets such as OWA, ActiveSync, or MailFlow.
Responders - action components triggered when a monitor reports a critical state for a probe result. They are the enforcement arm of the self-healing mechanism.
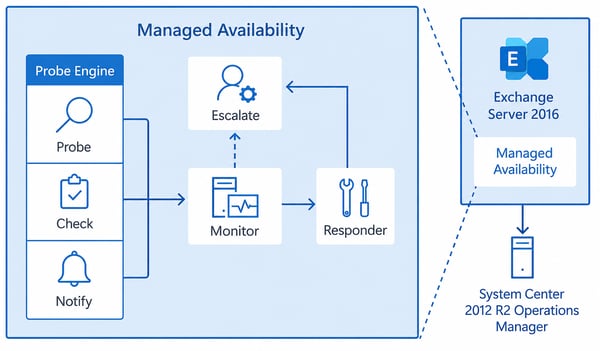 Figure 1. Managed Availability Architecture. Source: Managed Availability, Microsoft Learn
All of this happens automatically, without user interaction or proactive notification.
Managed Availability writes its actions to the Windows Event Log. And that is where it ends. No alert, no email, no push notification. If you are not actively monitoring the ManagedAvailability-Operational log, you may never find out that a responder action took place until someone asks why IIS restarted in the middle of the night.
What is Exchange Managed Availability? Managed Availability is Exchange Server’s built-in monitoring and self-healing engine, included in every version since Exchange Server 2013. It runs three parts: probes that test Exchange, monitors that judge the results, and responders that act on a problem, for example by restarting a service. It has no dashboard and sends no alerts; it writes to the Windows Event Log and works silently in the background.
You can find a concrete trace of how Managed Availability works directly in your mailbox databases: system mailboxes named HealthMailbox-XYZ, created automatically by Managed Availability, not by administrators. These mailboxes are used by Managed Availability's probes. Managed Availability logs into them, sends test messages, reads them back, and tests calendar operations.
This is where the main limitation becomes clear. A probe that checks a health mailbox verifies whether Exchange can communicate internally using system accounts under ideal network conditions, without external authentication. However, it does not confirm whether a real user with valid credentials can log in to OWA from outside. This distinction is exactly what an external monitoring solution should address.
Managed Availability monitors what Exchange itself controls. Everything outside that boundary is a blind spot. A green status does not necessarily indicate:
There is another structural limitation worth noting: Managed Availability is not a proactive early-warning system. It reacts to states that have already occurred, not to developing trends. Rising queue lengths or growing resource pressure are only escalated once a probe actually fails. If you want to detect issues earlier, you need different metrics.
Many organizations assume their Exchange environment is monitored because a monitoring agent runs on the server. Usually, this agent tracks infrastructure metrics such as server reachability, CPU usage, disk space, and message queue length. While these metrics are helpful, they do not indicate whether Exchange itself is functioning properly as an application.
What is almost always missing is visibility in Managed Availability and the Exchange Health Sets. Typically, the agent monitors the Event Log for critical events and may also verify whether mailbox databases are mounted. Beyond these checks, Exchange monitoring generally stops there.
Managed Availability and its Health Sets are left completely out of scope. No check whether a Health Set has shifted to Degraded or Unhealthy. No review of the Managed Availability-Operational log. No test for whether probes are systematically failing. The monitoring solution does not know what Managed Availability is doing in the background, and it does not try to find out.
This creates a false sense of security. The agent shows green because the infrastructure is still operational, but Managed Availability has already identified a degraded internal state and initiated response actions. Both processes run simultaneously, unaware of each other. Meanwhile, anyone monitoring the dashboard sees no indication of these issues.
The most dangerous part of Managed Availability isn't what it misses. It's how it reacts when it detects an issue. Responders perform automated actions, but their effects can differ greatly.
Application pool restarts
Barely noticeable. The first person to open OWA afterward experiences a brief delay for the ASP.NET warm-up. For admins without targeted app pool monitoring, this action is essentially invisible.
IIS restart
Noticeable. Active OWA sessions have dropped, AutoDiscover requests fail briefly, and ActiveSync clients lose their connection.
Exchange Transport Service restart
Affects mail flow directly. Messages in the delivery pipeline are delayed, and connections to the smart host or Exchange Online are briefly interrupted.
Full server restarts after bug check
The most severe action. In a properly configured DAG environment, another member takes over the databases, and users experience only a brief interruption. In single-server or dual-server environments without a fully configured DAG, this means a complete mail flow outage, with no prior warning and no opportunity for an admin to intervene.
The particularly dangerous scenario is a probe that fails not because Exchange actually has a problem, but because a temporary network timeout or a brief resource spike disrupted the test. Managed Availability interprets this as a critical state and restarts IIS or the entire server. The actual problem, for instance, an unstable network segment, remains untouched. The restart was a reaction to a symptom, not a cause.
Server restarts triggered by bug checks leave traces in the Windows System Event Log. Event ID 41 (Source: Kernel-Power) documents the unexpected restart, and Event ID 6008 (Source: EventLog) records the subsequent dirty system start. Without active monitoring of these events, a nightly restart may go completely unnoticed.
When admins recognize the limits of Managed Availability, the instinct is often to add more monitoring. More metrics, more thresholds, more alerts. That is understandable but dangerous if a fundamental principle gets lost along the way: a monitoring system that generates too many alerts stops being taken seriously.
Alert fatigue is not a comfort issue. It is a genuine operational risk. The pattern is consistent. A monitoring solution is set up and carefully configured at first. As the environment evolves, thresholds drift out of alignment, and over time, the system produces dozens of notifications each day. Most of them are false positives, triggered by miscalibrated limits or checks that were never properly adapted to the actual environment.
Admins develop coping strategies. Alert emails land in folders that are opened once a week. Tickets get auto-closed. The bar for what counts as a relevant alert keeps rising. Until the day a real outage is dismissed as just another false positive.
The goal is not a monitoring solution that reports everything. It is one that reports the right things. Calibrated thresholds, clear priority levels, defined escalation paths. Alert fatigue is solvable, but only when it is treated as the structural problem it is.
This is exactly where ENow comes in. The platform monitors Exchange environments from the outside, using synthetic transactions that simulate the actual user path. OWA login includes authentication, mail flow tests across all transport routes, and protocol checks for MAPI, EWS, ActiveSync, and AutoDiscover. The result is not the output of an internal Managed Availability probe. It is the answer to the question that actually matters: does Exchange work the way users expect it to?
ENow also monitors the metrics that Managed Availability does not focus on. Certificate expiration, DAG replication status, queue health, hybrid connection quality, and Exchange Online service status. All brought together in a single central dashboard. Proactive alerts inform you before Managed Availability steps in. Or before its self-healing becomes the problem.
Green is a color, not a guarantee. Exchange Managed Availability is a useful feature. It makes Exchange more resilient, responds automatically to certain failure states, and takes routine operational pressure off admins. But it is not a complete monitoring solution. And, more importantly, it is not a substitute for external monitoring.
A “green status page” indicates that your monitoring tool has not detected a critical state from the data Managed Availability surfaces. It does not tell you that Exchange is working from the user's perspective. Understanding that distinction is the foundation of a monitoring strategy you can actually trust.
In the next article in this series, we take a closer look at alert fatigue: how it develops, how to recognize it in your own environment, and how to get back to a monitoring setup you can genuinely rely on.
Managed Availability is Exchange Server’s built-in monitoring and self-healing system, included in every version since Exchange Server 2013. It runs probes that test Exchange, monitors that evaluate the probe results, and responders that take corrective action such as restarting a service or the server. It has no dashboard and sends no alerts. It records what it does in the Windows Event Log and otherwise runs silently.
No. Managed Availability only checks what Exchange itself controls, using internal system accounts under ideal conditions. It cannot confirm that a real user can sign in to OWA from outside, that mail flow works across every hybrid route, or that a certificate is about to expire. External monitoring covers those gaps by testing Exchange the way a user actually experiences it.
Health Sets group the probes and monitors for a specific Exchange service, such as OWA, ActiveSync, or MailFlow, and each set carries its own health state. Health Mailboxes are hidden system mailboxes named HealthMailbox-XYZ that Managed Availability creates automatically and uses to send test messages, read them back, and check calendar operations. They are the visible footprint of Managed Availability inside your mailbox databases.
A green dashboard reflects what your monitoring tool checks, not the true state of Exchange. Most tools watch infrastructure signals like ping, CPU, disk, and queue length, and leave Managed Availability and its Health Sets out of scope. Exchange can be self-healing a degraded internal state while your dashboard still shows green, because the two systems run at the same time and never compare notes.
Yes. When a monitor reports a critical state, a responder can escalate from an application pool recycle to an IIS restart, a transport service restart, or a full server restart after a bug check. In a properly configured DAG, another member takes over the databases. On a single server, an automatic restart means a full mail flow outage with no warning, sometimes triggered by nothing more than a brief network timeout.
Watch the ManagedAvailability-Operational log in Windows Event Viewer for responder activity, and the System log for restart evidence: Event ID 41 (Kernel-Power) for an unexpected restart and Event ID 6008 (EventLog) for a dirty shutdown. You can also query current health with the Get-ServerHealth PowerShell cmdlet. Because these signals are easy to miss by hand, teams surface them with monitoring.


Microsoft is changing how hybrid authentication works between on-premises Exchange servers and...
-1.png?height=175&name=Part%201%20Why%20Exchange%20Monitoring%20Fails%20Before%20Users%20Notice%20(1)-1.png)